Examples / AI
How do you diagram a RAG pipeline?
Updated
User -> Query Agent -> Vector DB -> LLM -> User. The message reaches the Vector DB on the second hop and the LLM on the third, so the animation shows the retrieval finish before the model is touched. User is written twice and drawn twice, the question leaving on the left and the answer arriving on the right.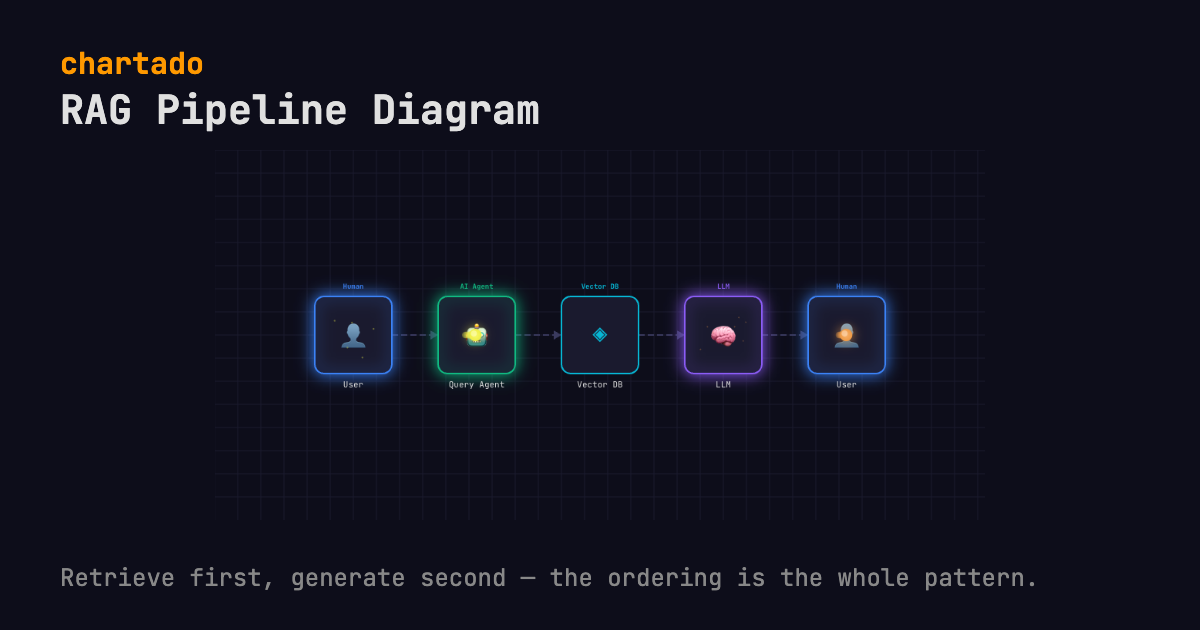
THE TEXT THAT DRAWS IT
User -> Query Agent -> Vector DB -> LLM -> UserEdit it in the box above and the diagram redraws as you type. Export it as an animated GIF, WebM, WebP or MP4 video, or a still PNG or PDF, every format free. WebM and PNG export here; the rest are in the app after a free sign-up. Every format embeds this text, so the file can be read back into the editor.
WHAT IT SHOWS
RAG exists so the model does not answer from memory alone. Four hops. A Query Agent takes the question, pulls relevant passages out of a Vector DB, hands the question and the passages together to the LLM, and the answer goes back to the User.
Everything hangs on the order. Retrieval comes before generation, and prose tends to describe it as the model consulting a database, which sounds like the two happen together. On the animation they do not. Hop two lands on the Vector DB, hop three lands on the LLM, and until hop three the model box has done nothing at all.
User is written twice, so it is drawn twice. Within a single line every segment makes a new box; the parser only starts reusing names from the second line onwards, which is the mechanism a return line uses to point back at something already drawn. Here that is the right picture anyway. Leaving with the question and arriving with the answer are two different moments, and drawing them at opposite ends keeps the whole thing reading left to right.
Money goes on the middle two hops, the vector search and the model call, and of the two it is the search that decides what the model gets to see. If the answer is wrong I would look at what came back from the Vector DB before touching the prompt. The prompt cannot put back a passage the search never returned.
QUESTIONS
- How do you show re-ranking in a RAG diagram?
- Give it a hop of its own:
Vector DB -> Reranker -> LLM. Reranker is a word the AI vocabulary knows (it gets the agent icon), and the message now stops there between the search and the model, which is where the candidate list gets cut down. - What part of a RAG system does the diagram not show?
- Indexing. Chunking and embedding the documents happens before any question arrives, and this line only draws the question path. Embedding the question itself is folded into the Vector DB hop; split it out with
Query Agent -> Embedder -> Vector DBif you want it visible, since Embedder has its own icon.
MORE AI PATTERNS
Multi-agent router diagram
A router agent in front of three specialist agents, drawn in one column so nobody reads them as a pipeline.
User -> Router Agent -> {Research Agent, Code Agent, Analysis Agent}
ReAct tool-calling diagram
Each turn the model calls a tool or answers, and a tool result goes back to the agent for another turn.
User -> Agent -> LLM -> |Tool, Response|
Human-in-the-loop diagram
A guardrail sends each output to Accepted or to a person, and the person's verdict goes back to the agent.
User -> Agent -> LLM -> Guardrail -> |Accepted, Review|
MCP architecture diagram
The agent talks to its MCP client and nothing else; the tools sit behind the server.
Agent -> MCP Client -> MCP Server -> |Knowledge Base, Code Sandbox, Memory|
Also on this site: Serverless REST API diagram, Pub/sub fan-out diagram, Queue worker diagram, Event pipeline diagram and Cloudflare Workers diagram. See all 10 patterns.
Chartado is a text-to-diagram tool: you type lines like A -> B, it draws the architecture and animates the flow.