Examples / AWS
How do you diagram a serverless REST API on AWS?
Updated
API Gateway -> Lambda -> DynamoDB. Each name is matched against the AWS keyword list, so all three boxes get the right icon, and one pass of the animation carries a request from the gateway through the function to the table. Nothing travels back unless you draw it; DynamoDB -> API Gateway on a second line adds the reply as a return flow through Lambda.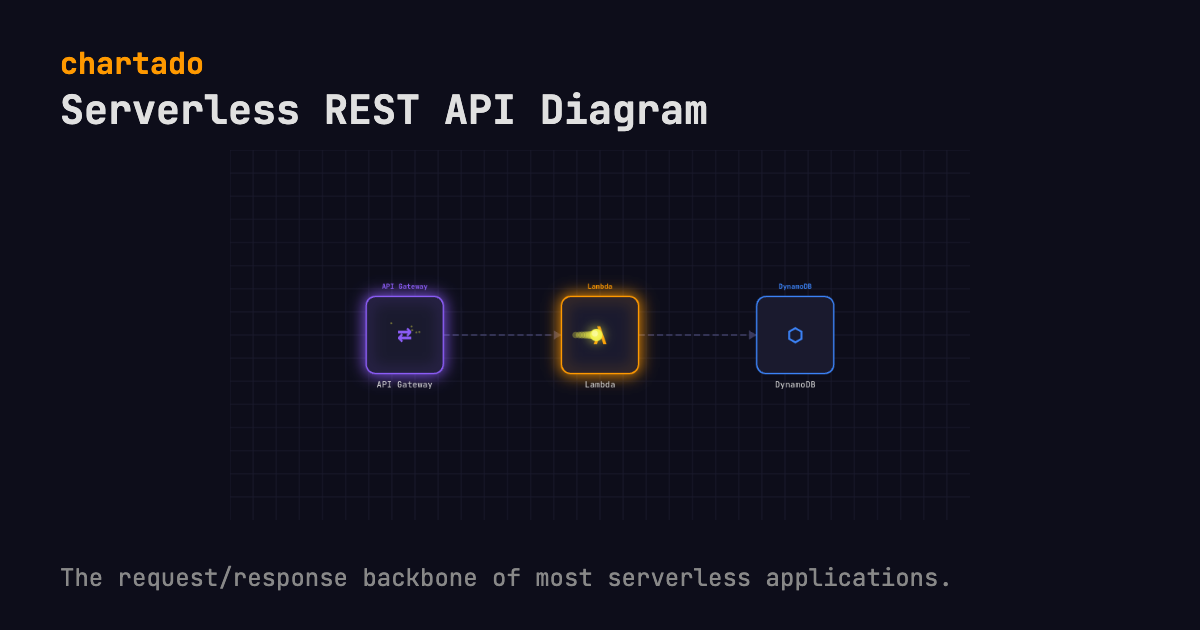
THE TEXT THAT DRAWS IT
API Gateway -> Lambda -> DynamoDBEdit it in the box above and the diagram redraws as you type. Export it as an animated GIF, WebM, WebP or MP4 video, or a still PNG or PDF, every format free. WebM and PNG export here; the rest are in the app after a free sign-up. Every format embeds this text, so the file can be read back into the editor.
WHAT IT SHOWS
Three boxes and two arrows. I think most serverless applications on AWS start as this and grow out of it.
A request hits API Gateway, which terminates TLS, matches the route, runs whatever authorizer you configured and throttles the caller. The gateway invokes a Lambda function, and the function is where the code lives. Whatever the code needs to remember goes in DynamoDB.
One flow. The message leaves the gateway, arrives at the function, leaves again and arrives at the table, and that is all the text asked for. Nothing travels back, because no line says it should. If you want the response drawn as well, add DynamoDB -> API Gateway on a second line and the parser plays the same two hops in reverse, half a second after the first pass ends.
Each hop is billed on its own terms. API Gateway charges per request, Lambda for the milliseconds the function runs, priced by the memory you give it, and DynamoDB per read and per write. Every hop is also somewhere a request can time out, and each arrow is a network call with its own price and its own limit, which makes a three-box drawing about the right size for arguing over cost or latency.
QUESTIONS
- What happens when Lambda scales under load?
- Each concurrent request gets its own Lambda execution environment, up to the account concurrency limit (1,000 per region by default), while there is still one gateway in front and one table behind. The diagram stays at three boxes because scaling makes more copies of the middle box and changes nothing else.
- How do I add more routes or tables to the diagram?
- Add a line.
API Gateway -> Lambda Orders -> DynamoDB Ordersreuses the gateway box you already have, because from the second line on a name that exists is matched rather than duplicated, and draws the new function and table in a second lane under the first. Both routes animate in the same pass.
MORE AWS PATTERNS
Pub/sub fan-out diagram
SNS hands the same event to two Lambdas and a queue at the same time.
SNS -> {Lambda Emailer, Lambda Analytics, SQS Archive}
Queue worker diagram
The first Lambda only enqueues, so the API answers at once and the worker takes as long as it needs.
API Gateway -> Lambda -> SQS -> Lambda Worker -> DynamoDB
Event pipeline diagram
The same event goes down a three-hop chain and straight into S3 at the same time.
EventBridge -> {(SQS -> Lambda -> DynamoDB), S3}
Also on this site: RAG pipeline diagram, Multi-agent router diagram, ReAct tool-calling diagram, Human-in-the-loop diagram, MCP architecture diagram and Cloudflare Workers diagram. See all 10 patterns.
Chartado is a text-to-diagram tool: you type lines like A -> B, it draws the architecture and animates the flow.